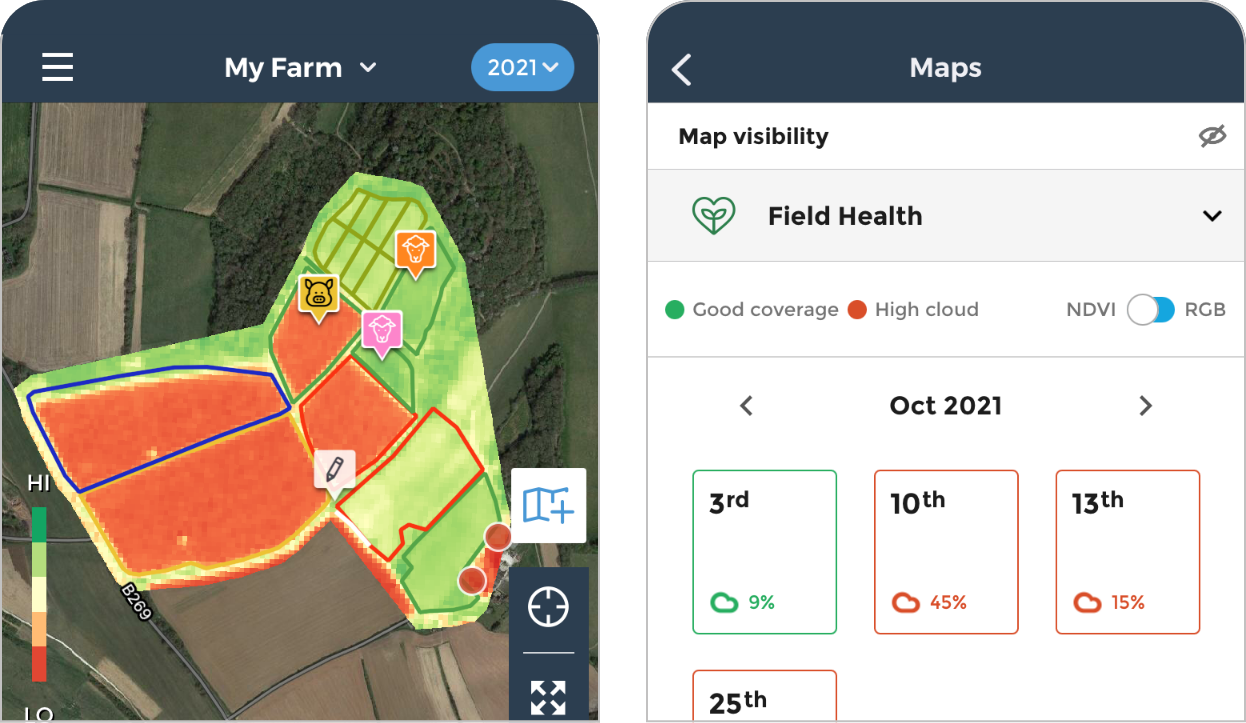
Field Health
See variation in performance with regularly updated satellite imagery analysis so you can focus your time in the field on the areas that need it most.
“When we needed to claim for defective seed, it was easy because we have everything documented with fieldmargin and we got our $30,000 payment.”
Dylan Gebers, Dairy Farmer, Zambia
Monitor your crop’s progress from space

More efficient scouting
Identify poor areas so you can go straight there when scouting and find the cause. Get ahead of issues reducing crop loss by finding and treating problems earlier.
Vary treatments based on performance
Save money on chemicals by treating your crops based on their need. Match with field observations, overlay scouting notes to see how what you’ve seen on the ground is affecting yield.


See if treatments and management decisions are making a difference with 3 years of historic data.
Compare over time
Frequently asked questions
What is NDVI analysis?
NDVI (Normalized Difference Vegetation Index) is the most commonly used method for assessing vegetation cover. It normalizes green leaf scattering in the Near Infra-red wavelength and chlorophyll absorption in the red wavelength. It is convenient for tracking the growth rate of plants and monitoring any changes to them.
The value range of an NDVI is -1 to 1. Negative values of NDVI (values approaching -1) correspond to water. Values close to zero (-0.1 to 0.1) generally correspond to barren areas of rock, sand, or snow. Low, positive values represent shrub and grassland (approximately 0.2 to 0.4), while high values indicate temperate and tropical rainforests (values approaching 1).
Where does your imagery come from?
We are using data from Sentinel 2, which is part of the European Space Agency (ESA)’s Copernicus Programme, processed by Sentinel Hub.
What resolution is your imagery?
Minimum resolution for Sentinel-2 is 10m.
How many years of imagery are available?
We have global imagery since 2015.
How frequently is it updated?
Sentinel-2 frequency of scanning depends on the latitude and vary from 3 to 5 days. We do not load images where cloud cover is over 50% as these will not provide sufficient useful data. This should result in an average of 1-2 images per week but this may vary depending on cloud cover.
How do I activate Field Health?
Field Health is a premium feature. In order to activate you will need to upgrade to a Pro subscription. You can find instructions for doing this here. A free 14 day trial is available to allow you to see the value of this data for yourself. If you are already a subscriber you can find instructions for viewing Field Health here.
How do you deal with clouds in satellite imagery?
We do not show imagery with more than 50% cloud. We show an indication of the cloud % for each date that we have imagery for so that you can choose to view the ones with best visibility.
Do you have coverage for my farm?
We have global coverage but the frequency that imagery is available is determined by the level of clouds at the location. If there are higher levels of cloud cover at a location then this will result in less frequently updated imagery.
Our farmers use fieldmargin with